
A Data-Driven Guide to Avoiding Property Oversupply in Australia
Protect your investment portfolio by mastering the key data indicators that signal an oversaturated property market.

Navigating the Australian property market in mid-2025 can feel overwhelming. For diligent investors, the biggest threat to long-term financial success isn't always a market crash, but a more subtle, localised risk: oversupply. When the number of properties for sale floods a market, it puts downward pressure on prices and rental returns, potentially stalling your portfolio's growth for years. The key to building a resilient portfolio is achieving capital growth, and that only happens when demand consistently outweighs supply.
This guide will teach you how to protect yourself. We'll break down the two types of oversupply—current and future—and provide a practical, data-driven framework to identify high-risk areas. By learning to interpret the right metrics, you can confidently select suburbs poised for sustainable growth and steer clear of those doomed to stagnate.
Understanding the Two Faces of Property Supply
To effectively analyse a market, you must differentiate between the properties available today and those coming tomorrow. Both have a profound impact on a suburb's investment potential.
Current Supply: This refers to the total number of properties currently listed for sale in a specific market. It’s a real-time snapshot of the competition you face as a seller and an indicator of the balance between buyers and sellers.
Future Supply: This is the pipeline of new properties set to enter the market. It includes everything from approved development applications (DAs) for new apartment blocks to vast tracts of farmland on the urban fringe zoned for residential development.
Many investors only focus on current supply, but ignoring the future supply pipeline is one of the biggest mistakes you can make.
Analysing Current Supply: Why Percentage Trumps Raw Numbers
At first glance, measuring current supply seems simple. You can go to a major property portal, search for a suburb, and get a raw count of listings. However, this number in isolation is dangerously misleading.
A Tale of Two Suburbs
Consider this real-world example from South Australia:
Suburb A (Morphett Vale): Has 40 houses currently listed for sale.
Suburb B (Onkaparinga Hills): Has only 6 houses currently listed for sale.
Based on the raw count, you might conclude that Morphett Vale is oversupplied and Onkaparinga Hills is a tight, undersupplied market. But this assumption is wrong. The missing piece of the puzzle is the total size of each market.
Morphett Vale is a very large suburb with over 9,000 houses.
Onkaparinga Hills is much smaller, with fewer than 900 houses.
To get a true sense of market pressure, we must calculate the Stock on Market (SOM) Percentage—the number of listings as a percentage of the total number of dwellings.
Morphett Vale's SOM: (40 ÷ 9,000) x 100 = 0.44%
Onkaparinga Hills' SOM: (6 ÷ 855) x 100 = 0.70%
The data now tells a completely different story. In percentage terms, Onkaparinga Hills has a significantly higher level of stock for sale than Morphett Vale. Both are still healthy markets (the Australian average is typically just under 1%), but the example proves that context is everything. Using powerful real estate analytics to calculate and compare SOM percentages is fundamental to sound decision-making.
Predicting Future Supply: The Google Maps Litmus Test
Analysing future supply is more complex than counting current listings. While checking a local council's website for Development Applications (DAs) seems like a logical step, it's often not enough. A developer can lodge a DA for 100 new homes the month after you purchase your property, instantly changing the supply dynamics without any prior warning.
The only reliable way to protect yourself from long-term, large-scale oversupply is to analyse the physical landscape of the area.
How to Assess Future Risk with Maps
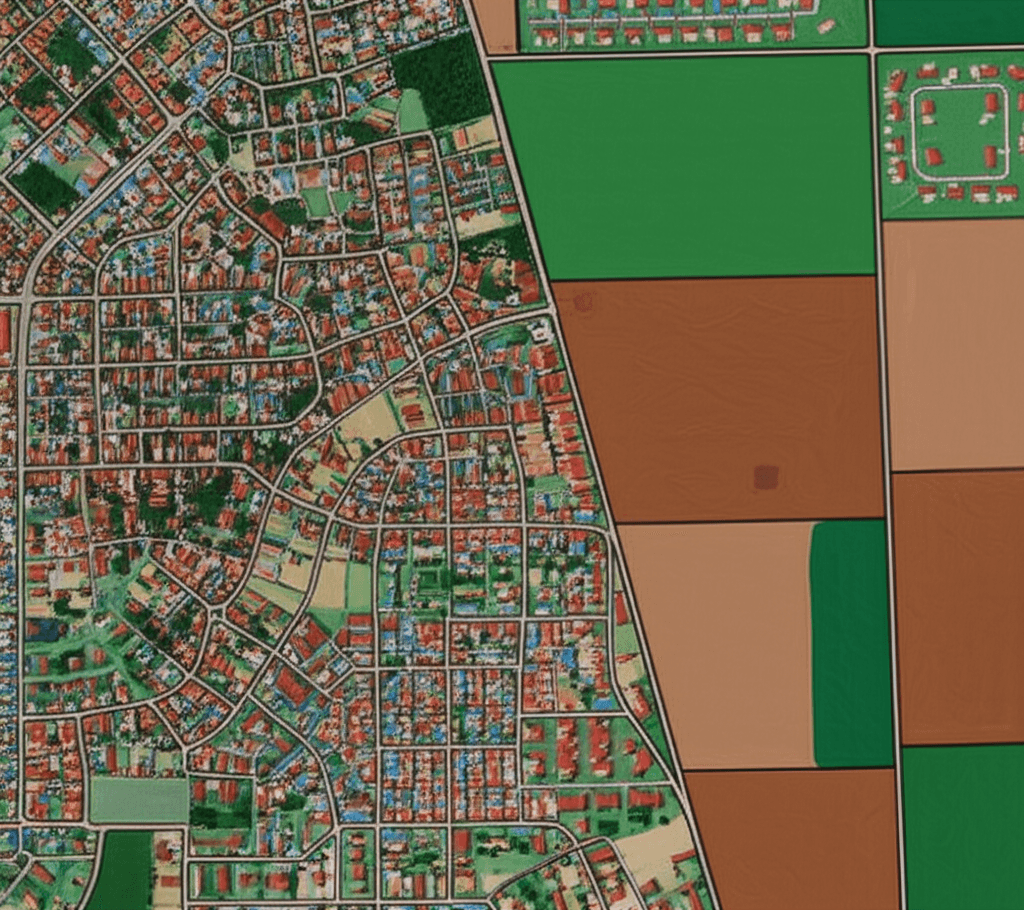
Open Google Maps and switch to the satellite view. Look for large tracts of vacant, undeveloped, or rural land surrounding your suburb of interest. This land is the source of future supply.
Low Risk: Established, built-up suburbs that are geographically landlocked. Think inner-ring suburbs surrounded by other suburbs, with no significant vacant land parcels available. Any new supply here comes from small-scale subdivisions (e.g., knocking down one house to build a few townhouses), which has a minimal impact on the overall market.
High Risk: Suburbs on the urban fringe, surrounded by farmland or large, undeveloped blocks. These are often marketed as "growth corridors." While population growth is positive, as noted by the Australian Bureau of Statistics (ABS), if it is catered for by a near-endless supply of new land, property price growth will be severely hampered for decades.
Developers will eventually build on that vacant land. It's not a matter of if, but when. The oversupply from these areas can suppress property values for suburbs even 5-7 kilometres away.
A Practical 4-Step Framework for Avoiding Oversupply
Here is a simple, actionable strategy to steer clear of oversupplied markets and select properties with long-term growth potential.
1. Prioritise Houses Over Units
Units are inherently more susceptible to oversupply. A single house on a decent-sized block can be knocked down and replaced with a block of 10, 20, or even 100+ apartments. This dramatically increases the supply in a very small geographical area. By purchasing a house, you own a finite asset—the land—and are insulated from this high-density supply risk.
2. Focus on Established, Built-Up Areas
Target suburbs where what you see is largely what you get. These are areas where the vast majority of land has already been developed. As mentioned, new supply is limited and slow to come to market. This scarcity is a powerful driver of long-term capital growth.
3. Identify and Avoid High-Risk Growth Corridors
Be extremely cautious of new housing estates on the fringes of major cities. Areas like Clyde North (Melbourne) and Marsden Park (Sydney) have historically shown extremely high Stock on Market percentages, sometimes as high as 6-7%. While they may seem affordable, the constant drip-feed of new house-and-land packages can keep prices flat for a decade or more, while established suburbs are booming.
4. Always Use Percentage-Based Data
Never rely on the raw count of property listings. Insist on using the Stock on Market percentage to accurately gauge the supply and demand balance. A low SOM percentage (ideally below 1%) is one of the strongest indicators of a healthy market primed for growth.
Conclusion: Build Your Defence with Data
Protecting your investments from oversupply isn't about guesswork; it's about a disciplined, analytical approach. By following these core principles, you can build a powerful defence against one of the biggest risks to capital growth.
Remember the simple rules:
Analyse Stock on Market percentage, not raw listing counts.
Use satellite maps to identify future supply risk from vacant land.
Buy in established, built-up areas away from growth corridors.
Prioritise houses over units to minimise density risk.
By integrating these strategies into your research process, you can cut through the market noise and confidently identify properties that will serve your financial future well.
Ready to put these principles into action? Explore HouseSeeker's powerful real estate analytics to analyse stock on market data, compare suburbs, and find investment-grade properties with confidence.
Frequently Asked Questions
What is a good Stock on Market (SOM) percentage for an investor?
A low SOM percentage is a strong positive indicator. Generally, a figure below 1% suggests that demand is outstripping supply, creating upward pressure on prices. Markets with an SOM above 2% should be treated with caution, as this may indicate a growing imbalance in favour of buyers.
Can a suburb with high population growth be a bad investment?
Yes, absolutely. High population growth is only beneficial for property prices if the supply of new housing is constrained. If a suburb's population growth is catered for by vast new land releases and housing estates (future supply), the constant stream of new properties can absorb all the demand, leading to stagnant price growth for years.
Are townhouses a safer option than units regarding oversupply?
Townhouses can be a middle ground. They generally offer a better land-to-asset ratio than apartments and are less susceptible to the massive density increases seen with high-rise towers. However, a detached house in an established, landlocked area remains the lowest-risk option for avoiding the potential pitfalls of future oversupply.