
The 18-Year Property Cycle Myth: What Australian Data Really Shows
Learn why focusing on national cycles is a mistake and how granular real estate analytics can uncover true growth opportunities.

Navigating the Australian property market in mid-2025 often feels like trying to find a signal in a sea of noise. Investors are constantly bombarded with theories, predictions, and 'sure-fire' strategies. One of the most persistent ideas circulating in podcasts, blogs, and forums is the '18-Year Property Cycle.' This theory suggests that property markets follow a predictable, long-term pattern of booms and busts, repeating roughly every 18 years.
But for savvy investors who prioritise data over dogma, this raises a critical question: does this theory actually hold up when tested against historical Australian data? Relying on a flawed model can lead to missed opportunities and poor decisions. This article will dissect the 18-year cycle theory, analyse 44 years of Australian market data to test its validity, and demonstrate a more reliable, data-driven approach to identifying high-growth property investments.
What is the 18-Year Property Cycle Theory?
The concept of an 18-year property cycle was popularised by British economist Fred Harrison. His work was primarily based on economic data from the United States and the United Kingdom, not Australia. The theory posits a recurring cycle of predictable phases, culminating in a major boom followed by a significant crash approximately every 18 years.
Despite its overseas origins, this theory has gained traction in Australia, with some commentators and investors adopting it as a framework for timing the market. The appeal is understandable; a predictable cycle would offer a simple roadmap for when to buy and when to sell. However, applying a model based on foreign markets to Australia's unique economic landscape without rigorous validation is a risky strategy. True market understanding comes from deep real estate analytics focused on local data.
Analysing 44 Years of Australian Property Data
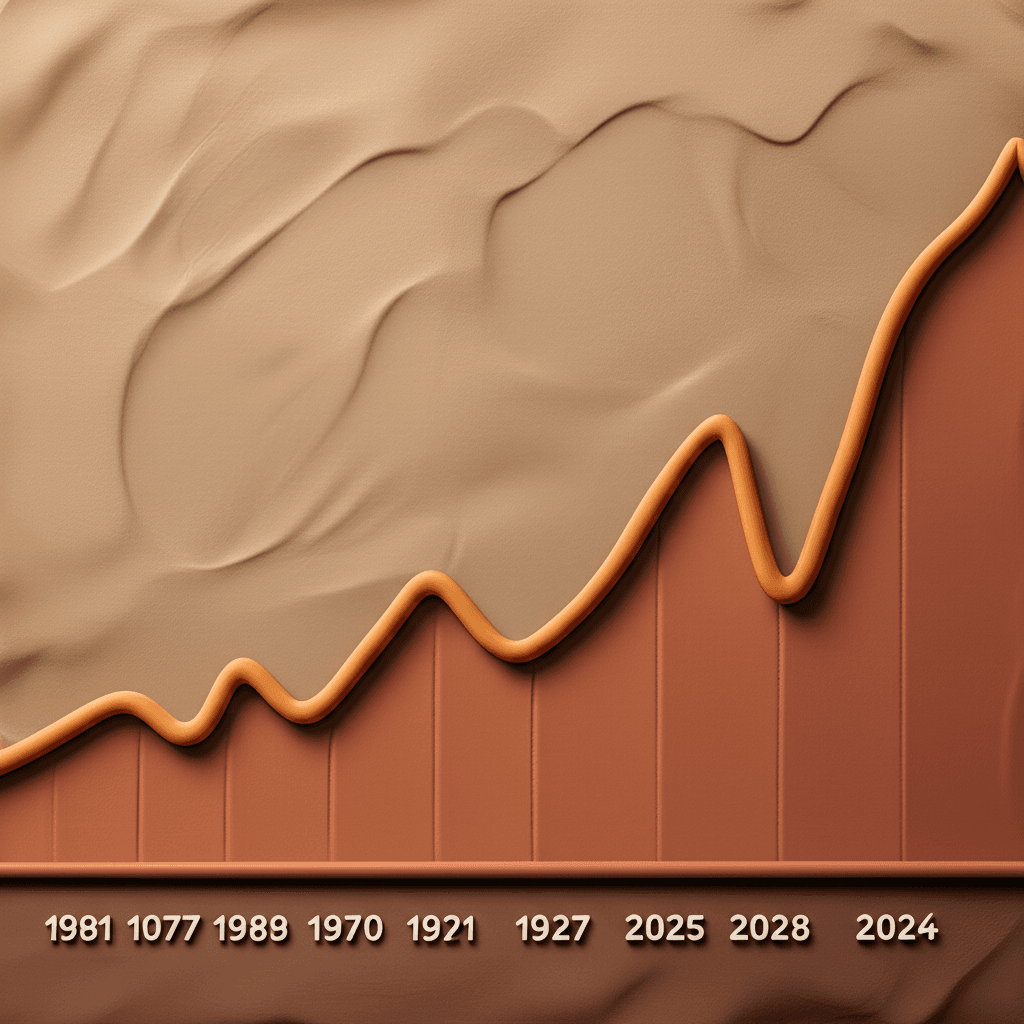
To test the 18-year cycle, we must look at the historical performance of the Australian market. By examining the national annual growth rate from the end of 1981 to mid-2024, we can identify the actual patterns, peaks, and troughs that have occurred.
Over the last four decades, the market has experienced periods of both extreme growth and significant decline. The most dramatic national growth surge occurred in the late 1980s, when prices peaked at an astonishing 31% annual growth. Conversely, the market has seen prices go backwards on a national level five times during this period, with the worst downturn happening around mid-2012, when the national growth rate hit approximately -5.5%.
The gaps between these downturns are far from consistent, varying from over a decade to less than three years. This immediate inconsistency already casts doubt on the idea of a fixed, predictable cycle. As of mid-2024, the national annual growth rate sits at a more moderate 7.7%, but this single figure hides the immense diversity of performance across different states, cities, and suburbs.
Testing the Cycle: The Problem with Defining a 'Boom'
A core component of the 18-year cycle theory is the regular occurrence of a major 'boom.' To test this, we first need to define what constitutes a boom. Is it 15%, 20%, or 25% annual growth? As we will see, the definition you choose drastically changes the outcome, revealing that any 'cycle' you find is often just a product of how you frame the data.
The 25% Growth Benchmark
Let's start with a strong definition: a boom is any period where the national annual growth rate exceeds 25%. Using this benchmark on the 44-year data set, we can identify exactly three distinct boom periods: 1. Late 1980s (peaking in 1989) 2. Early 2000s (peaking in 2002) 3. Post-COVID (peaking in 2022)
With these three peaks, we have two gaps to measure the 'cycle':
The gap between the 1989 peak and the 2002 peak is 13 years.
The gap between the 2002 peak and the 2022 peak is 20 years.
The average of these two gaps is 16.5 years. Not only is this not 18 years, but the significant difference between a 13-year gap and a 20-year gap shows a complete lack of consistency. With such a small and unreliable sample size, it's impossible to declare a predictable 18-year cycle.
The 20% Growth Benchmark
What if we lower the bar for a boom to a 20% annual growth rate? This more lenient definition introduces one additional boom period from the early 1980s.
This gives us four peaks and three gaps to analyse:
Gap 1 (1982 to 1989): 7.5 years
Gap 2 (1989 to 2002): 13 years
Gap 3 (2002 to 2022): 20 years
The average cycle length is now 13.5 years—even further from the supposed 18-year rule. More importantly, the variance is enormous, ranging from as short as 7.5 years to as long as 20. There is no reliable pattern here that an investor could use to make future predictions.
The 10% Growth Benchmark
To illustrate how easily data can be manipulated, let's lower the benchmark for a 'boom' even further to just 10% annual growth. This is only slightly above the long-term average growth rate.
Suddenly, we have nine distinct peaks in our 44-year chart. The average gap between these peaks shrinks to just 5 years. The cycles range from as short as 2.5 years to as long as a decade. This exercise demonstrates that you can create almost any 'cycle' you want simply by changing the parameters. You could write a book on the '5-Year Australian Property Cycle' using this data, but it would be just as misleading.
Why National Cycles Are a Flawed Investment Strategy
The analysis clearly shows that a consistent, predictable 18-year property cycle does not exist in Australian historical data. But beyond the numbers, the entire strategy of investing based on national cycles is fundamentally flawed for several practical reasons:
1. You Can't Buy the 'National Market': An investor doesn't buy 'Australia.' You buy a specific property on a specific street, in a specific suburb. While national trends provide context, the performance of individual markets can run completely counter to the national average. During national downturns, some suburbs were still experiencing positive growth, and during national booms, some were declining.
2. Markets Are Diverse and Fragmented: Australia is made up of thousands of distinct micro-markets, each with its own local drivers of supply and demand. A mining town in Western Australia behaves differently from a blue-chip suburb in inner Sydney. A data-driven approach requires a tool like an AI Property Search that can analyse these unique local factors.
3. Timing the Market is Ineffective: Even if a perfect 18-year cycle existed, what would be the strategy? Invest only once every 18 years? This ignores the power of compounding and the significant capital growth that can be achieved in the years between major national peaks. A 'set and forget' strategy based on a mythical cycle means leaving significant money on the table.

The Smarter Approach: Focus on Suburb-Level Data
Successful property investing isn't about waiting for a national wave to lift all boats. It's about finding the right boat in the right place at the right time. Instead of focusing on broad, unreliable national cycles, savvy investors drill down into granular, suburb-level data. This is where true opportunities are found, regardless of the overarching national trend.
Key metrics at the local level provide a much clearer picture of a market's potential for capital growth and strong rental returns. Data points published by sources like the Australian Bureau of Statistics (ABS) on population trends, combined with local market indicators, are crucial. By focusing on the fundamentals of supply and demand in a specific area, you can build a robust and resilient property portfolio.
Conclusion: Data Trumps Dogma
The 18-year property cycle is an enticingly simple theory, but it falls apart under the scrutiny of real Australian data. The historical record shows no consistent, predictable cycle that can be used as a reliable investment tool. The boom-bust intervals are erratic, and the very definition of a 'boom' can be manipulated to produce different results.
The key takeaway for investors is to move beyond these appealing myths and embrace a strategy grounded in evidence. Your success will not be determined by timing a non-existent national cycle, but by your ability to analyse specific, local markets and identify suburbs with strong underlying growth drivers.
Stop guessing and start analyzing. Discover the tools that separate savvy investors from the crowd. Our powerful real estate analytics platform cuts through the noise, providing the suburb-level data you need to make confident decisions and build long-term wealth.
Frequently Asked Questions
Is there any predictable cycle in the Australian property market?
No, there is no fixed, time-based cycle like the '18-year cycle' that can be reliably predicted. Australian property markets do move in cycles of growth, stagnation, and decline, but these are driven by a complex interplay of economic factors such as interest rates, credit availability, consumer confidence, and government policy, not a predetermined timeline. The length and intensity of these cycles are highly variable.
If I can't rely on national cycles, what data should I focus on?
You should focus on suburb-level data that reflects local supply and demand dynamics. Key metrics include vacancy rates (a low rate indicates high rental demand), rental yields, auction clearance rates, days on market, and the demand-to-supply ratio (DSR). Additionally, look at demographic data like population growth, local infrastructure spending, and employment trends, as these are strong leading indicators of future growth.
How can an AI-powered tool help me invest better?
Traditional property research is time-consuming and often relies on incomplete data. An AI-powered platform can process vast amounts of data from thousands of suburbs in seconds, identifying locations that meet your specific investment criteria. A tool like HouseSeeker's AI Buyer's Agent can go beyond simple filters, helping you uncover hidden gems, compare suburbs side-by-side with advanced analytics, and ultimately make faster, more informed, and less emotional investment decisions.