
A Data-Driven Guide to Finding High-Growth Properties in Australia
Unlock investment success by interpreting key market signals and looking beyond the headlines to identify genuine growth opportunities.
Introduction: Navigating the Noise of the Australian Property Market
The Australian property market in mid-2025 is a landscape of conflicting signals. On one hand, media headlines trumpet the long-term impact of major events like the upcoming Brisbane 2032 Olympics. On the other, cautionary tales circulate about markets that have already experienced significant growth, leaving many investors paralysed by the fear of buying at the peak. This constant barrage of information makes it incredibly difficult to know where to turn and who to trust. Do you bet on future infrastructure, or do you stick to what the current data says? How do you tell if a market is truly overheating or if it still has room to run?
This guide is designed to cut through that noise. We'll move beyond the hype and speculation to provide a clear, actionable framework for analysing property markets. By focusing on the fundamental principles of supply and demand, and by learning to interpret the right data points, you can build the confidence to make informed investment decisions. Forget trying to predict the future; the key to success lies in accurately assessing the present. Let's explore the metrics that truly matter and learn how to separate genuine growth signals from market distractions.
The Myth of Infrastructure: Why Big Projects Can Be a Trap
One of the most persistent narratives in property investment is that major infrastructure projects automatically signal future capital growth. The upcoming Brisbane 2032 Olympics is a perfect example, with many commentators suggesting it will trigger a decade-long boom for the city. While it seems logical, history shows that basing an investment strategy on large-scale infrastructure is a notoriously unreliable approach.
The problem isn't that these projects are insignificant. A multi-billion dollar investment in an area will undoubtedly have an economic impact. The real issue is the effect it has on the supply side of the property equation. Large, highly publicised infrastructure projects act as a magnet for property developers. They see the same headlines you do and begin planning new projects—apartments, townhouses, and large-scale housing estates—to capitalise on the anticipated surge in demand.
This creates a significant risk of future oversupply. As these new developments come to market, the increase in available housing stock can dilute demand and put downward pressure on prices, effectively cancelling out any positive impact from the infrastructure itself. We've seen this play out before, such as around the development of Western Sydney's Badgerys Creek Airport, where vast tracts of land led to a development rush that tempered price growth. The golden rule in property investing is that supply is the enemy of capital growth.
Instead of chasing headlines about future projects, savvy investors focus on the current, measurable imbalance between supply and demand. This data-driven approach provides a much clearer picture of a market's immediate growth potential, a topic we explore using our advanced real estate analytics.
Decoding Supply: Active Listings vs. Stock on Market
To accurately gauge supply, investors need to look beyond surface-level metrics. A common mistake is to simply look at the number of 'active listings' in a suburb. You might see 60 properties for sale and think supply is high, or 6 properties and think it's low. However, this raw number is meaningless without context.
A suburb with 10,000 dwellings might normally have 100 properties for sale, so 60 would indicate a tight market. Conversely, a small suburb with only 300 dwellings would be considered heavily oversupplied if it had 6 active listings. This is why the crucial metric is Percentage of Stock on Market (SOM%). This figure tells you what proportion of the total homes in a suburb are currently for sale, providing an apples-to-apples comparison of supply pressure across different markets.
The House and Land Package Distortion
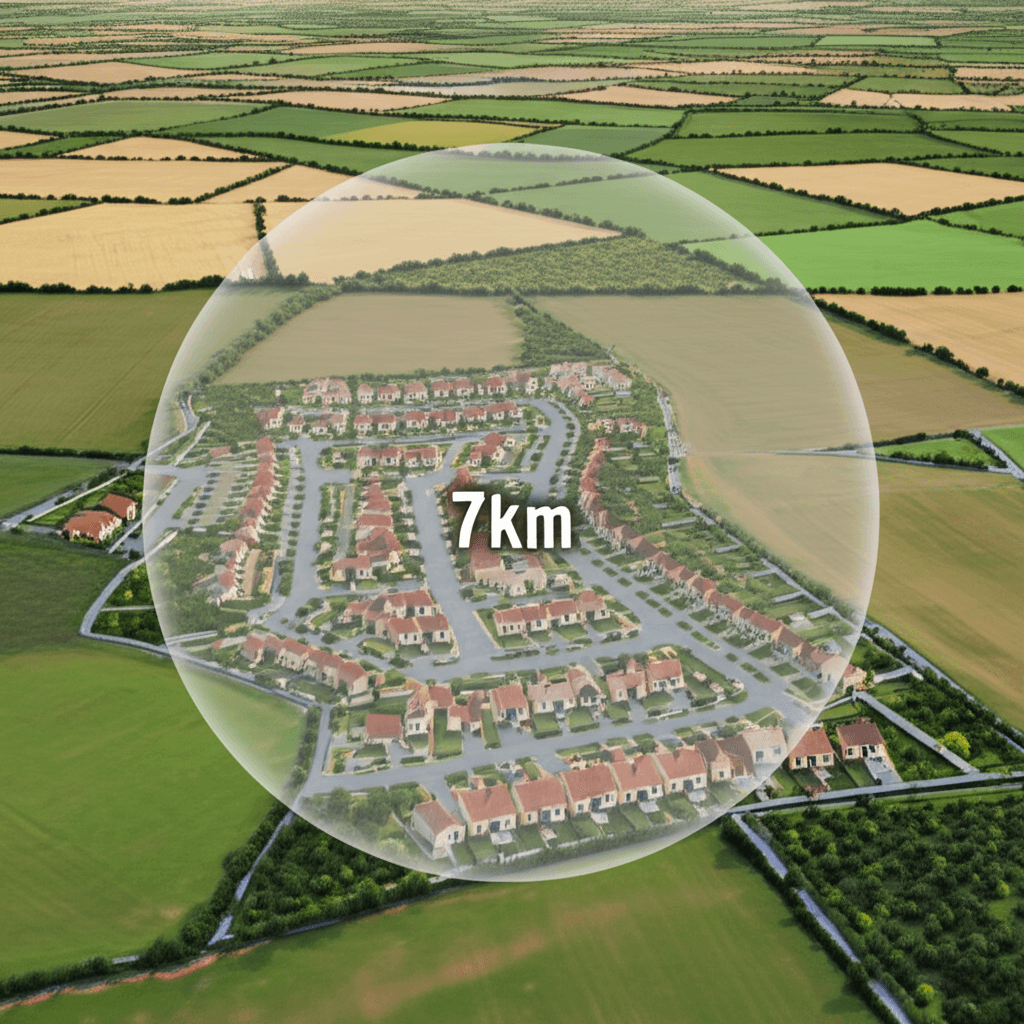
The accuracy of supply data can be further complicated by new developments, particularly house and land packages or off-the-plan units. These properties are often listed for sale long before they are built or even before the land is registered. In extreme cases, this can lead to a bizarre situation where a suburb's Stock on Market percentage is over 100%, as there are more properties listed for sale than currently exist.
This is a major red flag for investors. These 'greenfield' estates represent a massive pipeline of future supply. A quick check on Google Maps can reveal large areas of vacant, undeveloped land surrounding a suburb. As a general rule, it's wise to avoid investing within a 5-kilometre, and ideally a 7-kilometre, radius of these areas to protect your investment from being diluted by future development.
The 'Hot Market' Dilemma: Is It Too Late to Invest?
One of the biggest psychological hurdles for investors is buying into a 'hot' market—one that has already experienced a significant run-up in prices, like Perth and Townsville in recent years. The fear of buying at the top and immediately facing a downturn is a powerful deterrent. However, this fear often stems from the wrong question.
Instead of asking, "How much has this market already grown?", the more important question is, "Does demand still exceed supply?" As long as the imbalance in favour of demand persists, prices will continue to face upward pressure. A market doesn't stop growing simply because it has been growing for one, two, or even five years. Growth stops when supply catches up to or exceeds demand.
The key is to use real-time data to assess this balance. The 'hotter' the market—meaning the greater the imbalance—the stronger the momentum for continued growth. While past growth does suggest a market is closer to the end of its cycle than the beginning, it's far better to capture the last two years of a strong boom than to park your capital in a 'cool' market for four years waiting for growth that may never arrive.
Comprehensive real estate analytics allow you to monitor this dynamic constantly. By tracking metrics that reflect demand (like Days on Market) and supply (like Stock on Market %), you can make decisions based on current conditions, not past performance.

The Power of Aggregated Data
Manually tracking individual statistics like Days on Market, vacancy rates, rental yields, and auction clearance rates for every suburb in Australia is an impossible task. Furthermore, analysing any single metric in isolation can be misleading. A low vacancy rate is positive, but not if it's in a town with a declining population. A high yield is attractive, but not if it comes at the expense of capital growth.
The most sophisticated investment approach involves using a comprehensive algorithm that aggregates dozens of these leading indicators. By assigning different weightings to various metrics, these algorithms can produce a single, reliable score that summarises a market's overall supply and demand dynamic. This removes the guesswork and emotion from the analysis, allowing you to quickly identify suburbs with the highest probability of strong near-term growth, a method confirmed by extensive back-testing.
Modern platforms like HouseSeeker integrate this complex analysis into user-friendly tools. Our AI Property Search allows you to find properties based on these deep data signals without needing to be a data scientist. For those wanting a more guided approach, our AI Buyer's Agent leverages this same powerful analysis to provide personalised property recommendations aligned with your investment goals.
Conclusion: Data Over Drama
Successful property investing in today's complex market requires a disciplined, data-first approach. By shifting your focus from speculative headlines to measurable market fundamentals, you can build a strategy that is both resilient and effective. Remember the key principles:
Ignore the Hype: Major infrastructure projects are poor predictors of growth due to the risk of induced oversupply.
Focus on the Supply/Demand Imbalance: This is the primary driver of price movement. Growth will continue as long as demand outstrips supply.
Use Percentage-Based Metrics: Rely on metrics like 'Stock on Market Percentage' over raw numbers like 'Active Listings' for true comparability.
Don't Fear a Hot Market: If the data still shows a strong demand-supply imbalance, there is likely still growth to come.
By embracing these data-driven principles, you can navigate the market with clarity and confidence. The tools and information are more accessible than ever before; the key is knowing what to look for.
Ready to cut through the noise and make truly data-driven investment decisions? Explore HouseSeeker's powerful real estate analytics tools to uncover Australia's next high-growth suburbs.
Frequently Asked Questions
Should I avoid investing in any suburb with new house and land packages?
As a general principle, yes. The presence of large-scale new developments is a significant red flag for future oversupply. These estates can release hundreds, if not thousands, of new homes into the market over several years, which dilutes demand for existing properties and suppresses capital growth. The advice from seasoned analysts is to maintain a buffer zone of at least 5 to 7 kilometres from these large vacant land tracts to insulate your investment from this supply risk.
Can I collect and analyse all this property data myself?
Realistically, no. Manually tracking a metric like 'Days on Market' would require you to monitor every new listing in a suburb daily until it sells, a task that is impossible to scale across the country. Professional investors and analysts rely on specialist data providers and advanced platforms that collect, clean, and process millions of data points. Using a platform that aggregates this data into a simple, holistic score is the most efficient and reliable way to analyse market potential without getting lost in the complexity.
How long do property booms typically last?
There is no standard length for a property growth cycle. Some markets might surge for 18 months, while others can sustain strong growth for over five years. Because of this variability, trying to predict how much longer a boom has left is a form of market timing that is rarely successful. A more effective strategy is to continually assess the live supply and demand data. As long as the data shows a significant imbalance where buyer demand exceeds the available stock, the conditions for price growth remain in place, regardless of how long the boom has already been running.