Decoding Days on Market: A Guide to Accurate Property Investment Data
Uncover why 'Days on Market' figures vary so widely and learn how to use reliable data to identify high-demand Australian property markets.

Navigating the Australian property market in mid-2025 can feel like trying to find your way with a dozen different maps, each pointing in a different direction. You see a property listed, it disappears, and one data provider tells you it sold in 15 days, while another claims it took 50. This isn't just confusing; it's a direct threat to your investment success. One of the most critical, yet frequently misunderstood, metrics at the heart of this confusion is Days on Market (DOM).
This guide will demystify the DOM metric. We'll break down what it is, why it's a powerful indicator of market health, and most importantly, expose the reasons behind the wild discrepancies you see across different data sources. By understanding the methodology behind the numbers, you can cut through the noise and leverage accurate insights to make smarter, data-driven investment decisions.
What is Days on Market (DOM) and Why Does It Matter?
Days on Market is a straightforward concept: it measures the median number of days a property is advertised for sale before it is sold. The clock starts when a property is first listed on a major portal and stops when it is officially sold and the listing is removed. By aggregating this data for all sales within a specific market (like a suburb) over a set period, we get a clear picture of market velocity.
Why is this single metric so vital for investors?
It's a Barometer for Supply and Demand: DOM is a direct reflection of the supply and demand dynamics in a market. A low DOM signifies that demand from buyers outstrips the supply of available properties. In these 'hot' markets, buyers must act quickly, making competitive offers to secure a property. Conversely, a high DOM suggests a 'cold' or buyer's market, where supply exceeds demand, and properties linger for longer.
It Signals Price Pressure: A consistently low or decreasing DOM often precedes capital growth. High buyer competition naturally puts upward pressure on prices. As an investor, identifying markets with a downward DOM trend allows you to get in before a significant price surge.
It Validates Other Research: DOM should be a key component of your toolkit. When combined with other metrics like vacancy rates, auction clearance rates, and rental yields, it provides a comprehensive health check on a potential investment area. These are the foundational elements of powerful real estate analytics.

The Problem: A Case Study in Data Discrepancy
Theory is one thing, but the real-world application is where investors get stuck. Consider this recent, real-world example from an investor analysing the market in Kirwan, a suburb of Townsville.
They found two conflicting data points for the exact same market and time period:
Source A (HouseSeeker's Data Engine): 50 Days on Market
Source B (A Major Real Estate Portal): 15 Days on Market
This isn't a minor rounding error; it's a 233% difference. A DOM of 15 suggests a market on fire, where properties are snapped up in two weeks. A DOM of 50 suggests a more balanced, perhaps cooling, market. An investor acting on the 15-day figure might rush into a decision, overpay, or misjudge the local demand entirely. This single discrepancy could be the difference between a successful investment and a costly mistake.
So, how can two sources looking at the same market arrive at such radically different conclusions? The answer lies in the hidden methodologies behind the data.
Uncovering the Reasons for Inaccurate Data
Not all data is created equal. The value of a metric like DOM is entirely dependent on how it's calculated. When you see conflicting numbers, it's usually due to one or more of the following factors.
1. Different Calculation Timeframes (Monthly vs. Annual)
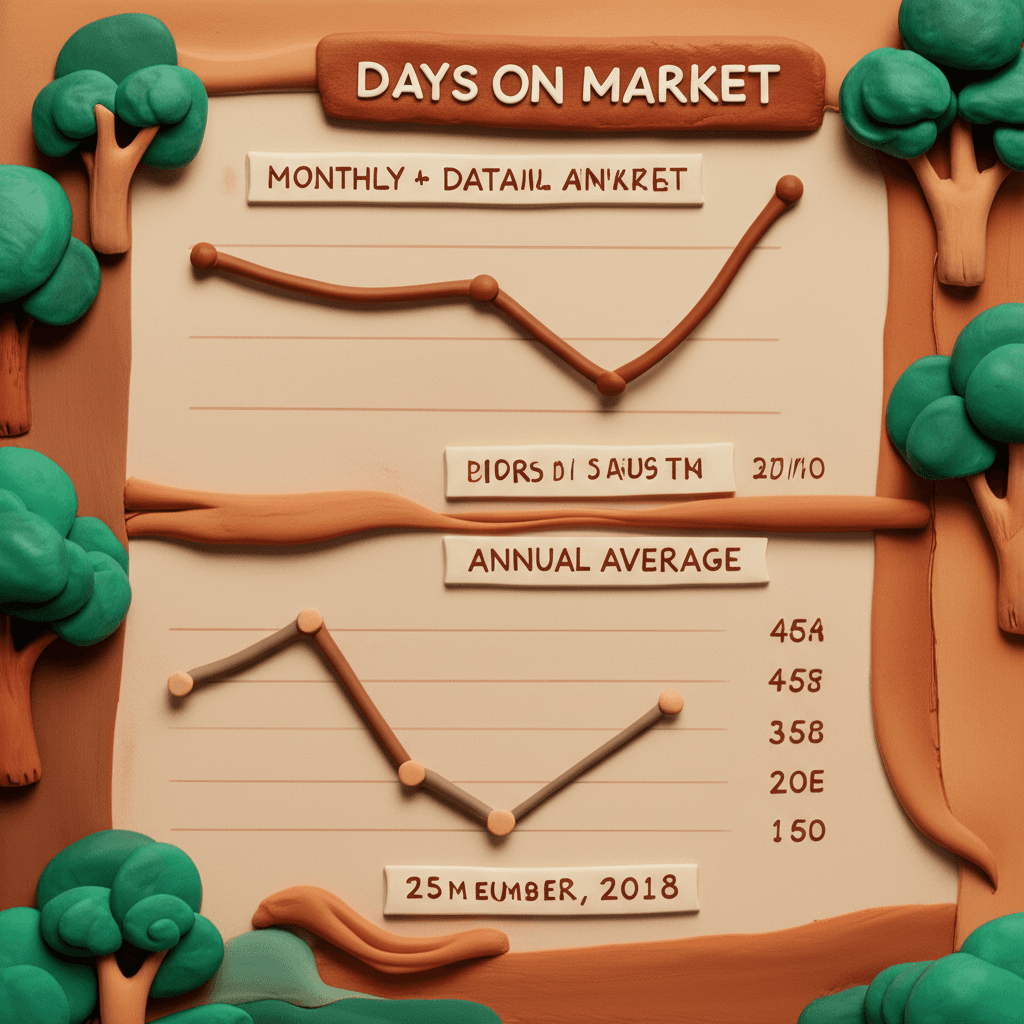
Many free data providers calculate DOM using a rolling 12-month median. This approach smooths out the data, which can hide emerging trends. A market that has been heating up significantly in the last two months might still show a high DOM because the average includes data from ten sluggish months prior.
At HouseSeeker, we champion a more current approach, analysing sales data on a monthly basis. This provides a more sensitive and timely read on market shifts, allowing you to spot accelerating demand as it happens, not six months later.
2. Varying Definitions of "Sold"
This is one of the most significant sources of discrepancy. When does the clock stop ticking?
The "Under Contract" Method: Some providers stop the clock the moment a property goes 'under contract'. However, a contract is not a guaranteed sale. Buyers have cooling-off periods, and sales are often subject to finance approval or building and pest inspections. If the deal falls through, the property comes back on the market, but the initial 'under contract' period might not be accurately recaptured. This method almost always results in an artificially low DOM.
The "Unconditional/Sold" Method: The most accurate approach is to keep the clock running until the sale is unconditional and the agent removes the listing from sale portals. This reflects the true time it takes from listing to a finalised, legally binding sale, giving you a far more realistic picture of the market.
3. Geographical Granularity (Suburb vs. Postcode)
Be wary of data provided at the postcode level. Some Australian postcodes contain dozens of suburbs, each with its own unique market dynamics. A booming suburb with a DOM of 20 days could be bundled in the same postcode as a struggling one with a DOM of 120 days. The resulting postcode-level average would be a misleading 70 days, rendering it useless for targeted investment analysis. Always insist on suburb-level data for genuine insight.
4. Potential Provider Bias
It's crucial to consider the business model of the data provider. Major portals generate the bulk of their revenue from real estate agents. It's in their interest to present markets in the most positive light possible to encourage listings and agent subscriptions. A lower DOM makes a market look healthier and can make an agent's performance seem more effective. While not necessarily intentional manipulation, this can lead to calculation methodologies that favour rosier outcomes.

The True Cost of "Free" Data
The allure of free data is strong, but as the saying goes, if you're not paying for the product, you are the product. In property investment, free data often costs you far more in the long run through poor decisions based on flawed or opaque information. The effort required to manually verify conflicting numbers, as in the Townsville example, is immense and impractical for the average investor.
To succeed, you need to move beyond surface-level numbers and partner with platforms that prioritise transparency and accuracy. Understanding how a metric is calculated is just as important as the metric itself. This is the foundation of a robust investment strategy, allowing you to combine metrics with confidence and use an AI property search to find opportunities that truly align with reliable data.
Conclusion: From Confusion to Clarity
Days on Market is more than just a number; it's a narrative about a suburb's desirability and momentum. However, that narrative can be easily distorted by inconsistent methodologies, outdated timeframes, and potential biases. By demanding transparency and understanding the 'why' behind the data, you transform from a passive consumer of information into an active, intelligent analyst.
Don't let misleading data derail your investment journey. Focus on timely, suburb-level metrics calculated with a clear and conservative methodology. This approach, which forms the core of our AI Buyer's Agent platform, is what separates successful investors from the rest.
Ready to build your portfolio on a foundation of trust and accuracy? Stop guessing and start analyzing. Explore [HouseSeeker's advanced real estate analytics](https://houseseeker.com.au/features/real-estate-analytics) to access transparent, reliable data and make your next investment with confidence.
Frequently Asked Questions
How often should Days on Market data be updated?
For maximum relevance and to spot emerging trends, DOM data should be updated monthly. This captures the latest transactions and provides a current snapshot of market velocity. Annual data can be useful for understanding long-term stability but may mask short-term shifts in supply and demand.
Is a low DOM always a good sign for investors?
Generally, yes. A low and falling DOM is a strong indicator of high demand and potential for near-term capital growth. However, it should never be analysed in isolation. You must cross-reference it with other key metrics such as vacancy rates, rental yield, population growth data from sources like the Australian Bureau of Statistics (ABS), and local infrastructure development to form a complete investment thesis.
Why can't I just use the free data from major portals?
While free data can be a starting point, its lack of transparency is a significant risk for serious investors. As this article highlights, undisclosed calculation methods, varying definitions of 'sold', and potential biases can lead to inaccurate figures. Relying on this data for a decision worth hundreds of thousands of dollars can be an incredibly costly mistake.
