
Decoding the 18.6-Year Property Cycle: A Guide for Australian Investors
Understand the historical patterns and data-driven strategies to navigate market fluctuations and protect your portfolio.
Introduction
The question of whether the Australian housing market is on the verge of a crash is a constant source of debate and anxiety for investors. A prominent theory that often surfaces during periods of rapid growth is the 18.6-year property cycle. This concept, almost a religion for some market analysts, suggests that property markets follow a predictable, long-term pattern of boom and bust. But is it a reliable roadmap for the future, or just a historical observation? This article will demystify the 18.6-year cycle, examine its relevance to the Australian market, and provide a clear strategy for making informed investment decisions, regardless of where we are in the cycle.
What is the 18.6-Year Property Cycle?
First popularised by economist Phil Anderson in his book, The Secret Life of Real Estate and Banking, the 18.6-year cycle theory proposes that Western economies, particularly their land markets, move through a consistent, repeating pattern. The cycle has been tracked back hundreds of years, primarily in the US and European markets. It’s a compelling idea because it offers a sense of predictability in the often-volatile world of real estate. The theory suggests that after a major economic event triggers a downturn, the market follows a distinct path towards its next peak, which is then followed by another significant correction.
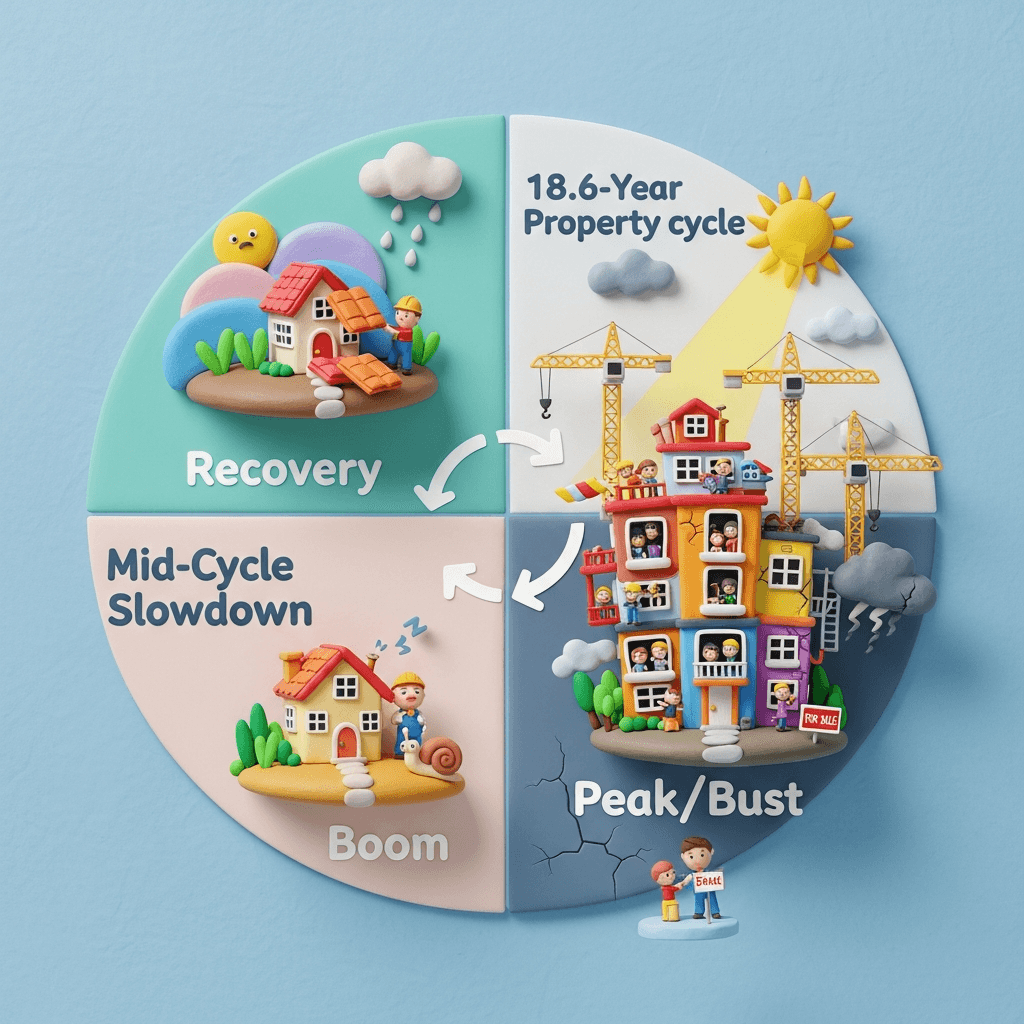
The Four Key Phases of the Cycle
The 18.6-year cycle is typically broken down into four distinct phases, which often mirror investor sentiment and economic conditions:
1. Recovery Phase (approx. 7 years): Following a major market crash (like the 2008 GFC), a period of recovery begins. Confidence slowly returns, lending starts to ease, new technologies emerge, and property prices begin a gradual upward trend. 2. Mid-Cycle Slowdown (approx. 2-3 years): After several years of growth, the market often experiences a brief pause or minor correction. This can be triggered by external events or a natural cooling-off period. The COVID-19 pandemic, for instance, caused a brief but sharp slowdown before the market accelerated again. 3. Boom Phase (approx. 7 years): This is where growth becomes more aggressive. Land prices rise significantly, and market sentiment is overwhelmingly positive. The final two years of this phase are often called the "Winner's Curse," a period marked by intense speculation, easy credit, and a widespread belief that the market can only go up. 4. Peak and Bust (The Crash): The cycle culminates in a market peak, which is followed by a major economic event or crisis. This triggers a significant downturn in asset prices, particularly in speculative markets, and the entire cycle begins anew.
How Resilient is Australian Property in a Global Downturn?
While the cycle theory is heavily based on US and UK data, its application to Australia requires nuance. During the 2008 GFC, the US share market plummeted by 40%, and American property values were devastated. In contrast, the Australian residential property market fell by a mere 2% nationally, with some cities like Perth even experiencing growth. This resilience stems from several factors, including stricter banking regulations and the fundamental nature of housing as a tangible, essential asset. During times of uncertainty, investors often move their capital from volatile assets like shares into the perceived safety of blue-chip residential real estate, which provides a floor for property values.
The Danger of Speculation and High-Risk Assets
Not all properties are created equal, especially during a downturn. The assets that get hit hardest are typically speculative. This includes off-the-plan apartments in oversupplied areas and properties in regional towns whose markets are driven by single industries or temporary trends. These markets lack the deep, diversified demand of major capital cities. Using retirement funds, such as a Self-Managed Super Fund (SMSF), to invest in these speculative assets is a high-risk strategy that can jeopardise a lifetime of savings. In a downturn, these assets can become illiquid, meaning you can't sell them because there are simply no buyers.

Key Fundamentals That Signal a Market Shift
Rather than trying to perfectly time a cyclical crash, savvy investors focus on the underlying market fundamentals. A market slowdown is typically driven by a few key factors:
Supply and Demand: A market slows when supply finally catches up to and exceeds demand. In cities like Perth and Brisbane, a chronic undersupply of housing relative to strong population growth continues to fuel price increases.
Affordability: Eventually, prices hit a ceiling where local wages can no longer support further growth. We've seen this in Sydney, where the market has stagnated for long periods after hitting an affordability peak.
Sentiment and Global Events: A change in market sentiment, often triggered by media narratives, rising interest rates, or global events, can cause buyers to pause and demand to cool.
Migration: Government policy on migration is a major demand lever. A reduction in migration numbers would ease pressure on housing and could lead to market stagnation.
Understanding these drivers with powerful tools is key. Using a platform with in-depth real estate analytics allows you to track these metrics in real-time and make proactive decisions.
Your Strategy: Prudence and Quality Over Speculation
For investors nervous about a potential downturn, the advice is clear: focus on quality and be more selective than ever. Inactivity can be costly, but so can a reckless investment. Stick to blue-chip locations in major capital cities with diverse economies and proven long-term growth. Ensure any property you consider has strong fundamentals—good location, desirable features, and broad appeal to both owner-occupiers and renters. Most importantly, maintain a strong financial position with significant cash buffers (well over 10% of the property value) to weather any storms and be ready to capitalise on opportunities that arise during a downturn.
Conclusion
The 18.6-year property cycle is a valuable framework for understanding long-term market behaviour, but it's not a crystal ball. While current signs—high speculation, easy credit, and record asset prices—share similarities with past cycle peaks, the Australian residential market is underpinned by unique strengths, including strong demand and tight supply in key cities. The greatest risk isn't a predictable crash, but being overexposed in low-quality, speculative assets. By focusing on blue-chip properties and maintaining robust financial buffers, you can build a resilient portfolio that not only survives but thrives through all phases of the market cycle.
Ready to navigate the property market with confidence? Discover how HouseSeeker's AI-powered real estate analytics can help you identify high-quality, resilient investment opportunities based on real-time data, not speculation.
Frequently Asked Questions
What is the 18.6-year property cycle?
The 18.6-year property cycle is a theory suggesting that real estate markets move through a predictable, long-term pattern of boom, bust, and recovery. It consists of four main phases: recovery, a mid-cycle slowdown, a boom phase (ending in a 'winner's curse'), and finally a market peak followed by a crash.
Does the Australian residential market fall as hard as the stock market?
No. Historically, the Australian residential property market has been far more resilient than the stock market during economic downturns. During the 2008 GFC, for example, the Australian property market saw only a minor dip of 2%, while share markets fell by up to 40%. This is because housing is a tangible, essential asset that people turn to for stability.
How can I protect my property portfolio during a downturn?
The best protection is to focus on asset quality. Invest in blue-chip properties in major capital cities with strong, diverse economies and high demand. Avoid speculative markets like regional towns with limited economic drivers. Additionally, maintaining a significant cash buffer is crucial to manage holding costs and avoid being a forced seller in a weak market.